
Originally published August 28, 2025 · Substantively revised October 17, 2026
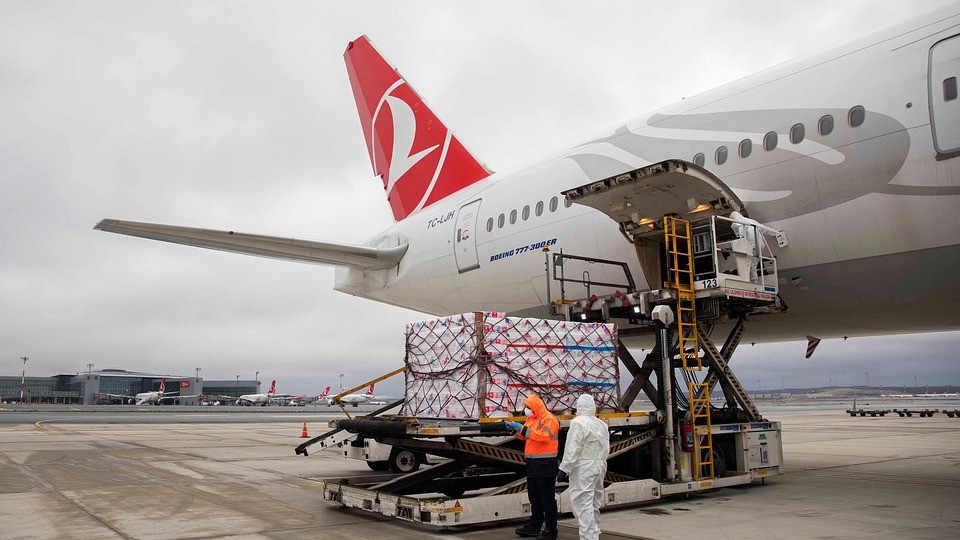
A stronger global cargo market does not necessarily mean a more predictable operating environment. For a forwarder managing a customer’s production deadline, a handler planning tomorrow’s shift, or an airport weighing a warehouse investment, the useful question is more specific: what is changing on the lanes and at the handoffs that determine service, cost, and margin?
E-commerce, changing sourcing patterns, trade policy, and geopolitical disruption still matter. But an airport ranking or a global growth rate is a starting point for investigation. The operating advantage comes from recognizing a pattern, testing its cause, and deciding what to change before a customer commitment fails.
- What capacity must we protect? Identify recurring freight whose delivery consequences justify a firm commitment.
- Which alternative can we actually execute? Validate the full route, including clearance, collection, and final delivery.
- Which ground bottleneck should we fix first? Use measured delay and recovery cost to choose the intervention.
How to use this article: Bring the watchlist below to your weekly operations meeting. Select the two exceptions with the greatest effect on customer delivery or margin. Leave with an accountable owner, a specific action, and a decision deadline; review the results at the next meeting.
What the updated numbers tell us—and what they do not
ACI World’s September 2026 report puts global airport cargo volume at 131.2 million metric tonnes in 2025, up 3.3%. Separately, IATA reported August 2026 airline cargo demand up 4.4% year over year, measured in cargo tonne-kilometers (CTK), while available cargo tonne-kilometers (ACTK) declined 0.1%. Its August market analysis shows year-to-date demand up 4.6% against capacity growth of 1.5%.
These measures answer different questions. Airport tonnes describe cargo handled; CTK incorporates distance flown; ACTK measures offered capacity. They are not interchangeable measures of unique goods shipped. Neither a global capacity total nor an average load factor tells a forwarder whether suitable space is available for a particular departure, shipment size, commodity, or service requirement.
Directional reading: demand growing faster than capacity supports closer scrutiny of space commitments and recovery options. It does not justify an automatic rate increase, a blanket charter decision, or the assumption that every market is tight. Confirm the exposure using booking acceptance, actual uplift, usable capacity, and all-in quotes on your own lanes.
Airport rankings are clues, not a sourcing map
ACI’s final 2025 rankings place Hong Kong first at approximately 5.1 million tonnes, Shanghai Pudong second at 4.1 million, and Anchorage third at 3.9 million. Louisville and Miami grew 13.5% and 13.6%, respectively. Memphis fell from third to sixth, with volume down 20.9%; ACI links that change to the loss of the USPS contract in late 2024.
The Memphis example is a useful warning: a contract or network change can move an airport’s ranking without demonstrating a broad collapse in its regional economy. Likewise, growth at a hub does not establish that nearshoring caused it. Throughput can reflect transfers, carrier decisions, consolidation, or customer concentration. Anchorage’s published figure also includes transit freight.
Three forces to translate into operating decisions
1. E-commerce: manage the entry process and the work per shipment
A tonne of consolidated industrial freight and a tonne of small parcels can create very different workloads. Pieces, shipment count, data quality, screening needs, and exception handling belong beside weight in staffing and pricing decisions.
The policy baseline has also changed since the original article. The February 20, 2026 executive order continued suspension of the Section 321 duty-free de minimis exemption, with specified statutory exceptions. It requires appropriate ACE entries for covered non-postal shipments and provides separate postal arrangements. Do not build a current parcel model around the former general $800 duty-free assumption or reuse an old postal duty schedule.
Operational response: establish who supplies classification, origin and value; who is importer of record; who files and pays; and who resolves incomplete data before freight moves. Have the broker validate current shipment-specific requirements. Price clearance, returns, storage, and manual exceptions explicitly. Monitor entries and labor minutes per shipment as well as kilograms handled.
2. Nearshoring: verify the freight pattern before committing capacity
A sourcing announcement is a lead to qualify. The stronger evidence is recurring purchase orders, production milestones, booked freight, and a credible shipment profile. A new manufacturing location may require urgent inbound components while finished goods move by road or sea. It may create a temporary launch surge rather than a permanent air lane.
Operational response: build a customer-specific origin–destination map by part or product family. Separate launch freight, recurring replenishment, and emergency recovery. Test border processing, truck transit, operating hours, backhaul demand, and the availability of qualified handling. Use a limited pilot and staged commitments before taking a lease or underwriting dedicated lift.
3. Geopolitics: qualify a recovery route before selling it
An ocean delay, airspace restriction, or carrier schedule change does not automatically become profitable air demand. Product value, dimensions, remaining inventory, customer willingness to pay, and actual aircraft capacity determine whether an alternative works.
Operational response: qualify an alternative against the actual shipment: carrier acceptance, connections, customs, screening, special handling, and final delivery. Establish who can authorize the added cost before disruption makes the decision urgent.
The key distinction: structural change or temporary displacement?
Three different operating stories can produce the same increase in airport tonnes. Demand growth means more underlying freight. Network displacement means freight is using a different route. Timing displacement means freight moves earlier or later than planned. Only the first necessarily expands the underlying market; all three can create a short-term bottleneck.
Test the explanation against repeat bookings from several customers, purchase-order timing, commodity mix, and the persistence of origin–destination flows. Compare like-for-like weeks and account for holidays, shipping-day differences, promotional launches, and prior-year disruption. A larger transshipment flow is not proof that local manufacturing has expanded. A rush before a policy deadline can borrow volume from the following month.
Directional implication: if repeat demand broadens across customers while acceptance and uplift deteriorate, consider protecting a defined base of capacity. If inquiries jump but conversion weakens, preserve flexibility. If flights perform normally while clearance or collection slips, fix the ground process before buying more lift. Review these explanations together; no single metric establishes the cause.
Make the customer deadline the planning constraint
For a production-critical shipment, work backward from the time the part must be available at the plant—not from the scheduled aircraft arrival. Include breakdown, customs release, collection availability, truck cutoff, delivery, and receiving hours. The resulting latest safe departure is the point beyond which the normal route can no longer credibly support the commitment. Use an agreed reliability allowance based on observed variability.
Illustrative example—not a client result: a part is required at 6 a.m. Thursday. One itinerary arrives Wednesday at 6 p.m., but the warehouse normally makes freight available at 10 p.m.; the last usable truck departs at 9 p.m. That route misses the delivery plan even if the flight is on time. An earlier flight, a confirmed after-hours collection, or an alternate gateway with a validated truck connection may solve the problem. A faster airport-to-airport service alone may not.
Give customer service, procurement, the broker, and operations the same milestone plan and escalation deadline. A contingency approved after its truck cutoff is no longer a contingency.
Buy flexibility deliberately—and measure its price
Protect recurring critical demand with capacity commitments sized to credible base volume; preserve appropriate flexibility for uncertain demand. Compare minimum volumes, unused-space charges, cancellation terms, shipment restrictions, recovery provisions, and rate validity. An allotment is valuable only when its conditions fit the freight you actually tender.
Evaluate an alternative gateway using total delivered cost and delivery reliability. Include extra trucking, handling, brokerage, storage, potential rework, and the customer’s delay exposure. Test whether the backup relies on the same constrained handler, trucking pool, transfer point, or customs process.
Illustrative economics—not a market quote: saving $0.30 per kilogram on 10,000 kilograms reduces linehaul cost by $3,000. If extra trucking, handling, and brokerage cost $2,400, the saving is $600 before storage, delay, or recovery costs. One $900 recovery expense turns it into a $300 loss. Compare this with the existing route on the same scope; calculate the forwarder’s contribution separately from the shipper’s full landed economics.
Set customer-specific triggers: a projected delivery failure prompts a recovery decision; deteriorating uplift prompts an allocation review; weaker demand prompts reassessment before the capacity cancellation deadline. Give each trigger an owner and a latest decision time.
A weekly watchlist that leads to action
Use a common definition for every metric and compare the same lane, service, and commodity mix. The suggested owners and review cadence are a starting point; assign one accountable person in your organization. Set action thresholds from actual performance, customer deadlines, and contractual obligations.
| Signal to track | Pattern to test | Decision it can inform |
|---|---|---|
| Booking acceptance, rejected requests, offloads, and quote validity Suggested owner: Capacity procurement / carrier operations Review: Daily on critical lanes; weekly allocation review | Repeated deterioration alongside firm bookings may indicate a capacity squeeze. | Reconfirm allotments; protect critical shipments; obtain a qualified recovery quote. |
| Quotes versus confirmed bookings, cancellations, pieces, weight, and customer concentration Suggested owner: Commercial lead with demand planning Review: Weekly; daily during a material demand change | Inquiry growth without conversion may be shopping or uncertainty; one account may dominate a volume increase. | Adjust staffing and exposure before making longer capacity commitments. |
| Data errors, customs holds, release time, and exception labor Suggested owner: Brokerage / compliance lead with shipper data owner Review: Daily exceptions; weekly recurring-cause review | Stable flight performance with longer clearance can point to a documentation or entry-process problem. | Fix upstream data ownership with the shipper and broker before buying faster transport. |
| Truck queue, dock turn, freight availability, and missed collection windows Suggested owner: Station / warehouse manager with trucking lead Review: Each shift; weekly partner review | Growing ground dwell with stable uplift suggests a handoff constraint. | Review appointments, warehouse shifts, screening queues, and truck scheduling together. |
| All-in recovery cost, contribution margin, and delivery performance Suggested owner: Account lead with finance and operations Review: Weekly exceptions; monthly account profitability | Higher revenue with more premium trucking, storage, rebooking, or claims may conceal weaker economics. | Reprice the service or reset the operating plan and customer promise. |
Assign an owner and a decision deadline to each exception. Review the median and the late tail—such as the 90th percentile—rather than allowing an acceptable average to hide the shipments that miss customer deadlines. Keep a short decision log so the team can see whether an intervention improved performance.
Know when reliability earns a premium—and when to reset the commitment
A service premium is defensible when the operating plan protects something the customer values: a production window, product condition, a launch date, or a dependable replenishment cycle. Define the outcome, document performance, and make the scope clear. Priority booking alone does not establish a reliable delivered service.
Repeated exceptions are also a commercial signal. If the account routinely needs premium trucking, manual clearance work, storage, or rebooking outside the priced scope, identify the cause and cost with the customer. Correct a failure within your responsibility; where the customer’s requirements or shipment profile have changed, agree on a revised price, cutoff, data requirement, or service level.
If the requested deadline cannot be supported by a qualified route, reset the promise before accepting the freight. Declining an unworkable commitment can protect both the relationship and the operation. Sales, operations, and finance should share authority for exceptions rather than leaving the station to absorb their cost.
What this means for each part of the cargo chain
- Forwarders: segment freight by delivery consequence, not simply account size. Distinguish production-critical, perishable, launch, and flexible inventory. Confirm when a quote becomes a capacity commitment and who bears recovery cost.
- Carriers and handlers: plan against arrival waves, dimensions, special handling, build-up deadlines, and labor skills. Tonnes alone are an incomplete staffing measure. Share booking changes early enough to adjust the shift.
- Airports and warehouse operators: identify the binding constraint before selecting a capital project. More apron space will not resolve a truck queue caused by dock layout, limited collection hours, or a shortage of screening capacity.
- Shippers and finance leaders: compare the full delivered outcome: freight, handling, brokerage, duties where applicable, inventory carrying cost, recovery, and the consequence of delay. A cheaper airport-to-airport rate can produce a more expensive customer delivery.
The ground infrastructure agenda has moved forward
This is where Diakon’s client work connects directly to operating performance. Our work for the Airforwarders Association has included congressional outreach seeking greater attention to air cargo infrastructure, including a GAO review. The value of that engagement is translating warehouse, truck-access, and freight-planning problems into evidence policymakers can use.
GAO’s July 2025 report, GAO-25-107334, identified limitations in some DOT cargo data and ground infrastructure challenges reported by selected stakeholders. Its interviews were a nongeneralizable sample, not a census of every airport. The report supports targeted diagnosis rather than a claim that no federal cargo data exists.
The follow-up matters. GAO’s page, checked October 17, 2026, still lists both recommendations as open. Its July 2026 updates record DOT work on data reliability and stakeholder engagement, including air cargo challenges and potential responses in the 2026 National Freight Strategic Plan. DOT’s stated September 30 target for data work is not proof of completed implementation; GAO’s status remains the reference point.
The 2026 National Freight Strategic Plan, released in May, is now the relevant national framework. Its aviation discussion identifies landside access and roadway congestion as constraints on cargo operations. DOT’s FY26 INFRA program page, updated October 14, 2026, also identifies eligible landside surface access to major air cargo hubs as an investment interest, subject to statutory eligibility. That is a concrete planning connection—not a promise that a private warehouse project qualifies or that a funding round remains open.
For an airport or industry association, connect the cargo facility’s bottleneck to the state freight plan and the responsible roadway agency. Define the sponsor, affected users, safety and reliability benefits, project scope, and potential eligibility before building a funding strategy.
Practical contribution: document truck wait times, missed handoffs, roadway conflicts, warehouse limitations, and the cost of recovery. Identify the responsible facility owner or public agency and separate operating changes from capital needs. A measured problem with a defined remedy makes a stronger planning or funding case than a general call for a larger cargo facility.
Use technology to close a specific operating gap
Before buying a visibility or AI tool, identify the decision that arrives too late today. Capture consistent milestone timestamps for acceptance, uplift, arrival, availability, release, collection, and delivery. Separate estimated events from confirmed events and assign an owner to missing or conflicting updates.
A useful pilot might reduce manual clearance exceptions or flag freight that will miss a truck connection. Measure the change in exception labor, missed cutoffs, recovery cost, and delivered service. A more attractive dashboard without a faster or better decision is not an operating improvement. Keep a usable fallback when a partner’s data feed is unavailable.
Sustainability belongs in the service and cost model
ReFuelEU Aviation places SAF supply obligations on aviation fuel suppliers, with a minimum share starting at 2% in 2025, alongside separate duties for covered aircraft operators and airports. It is not a universal requirement that each cargo shipment purchase a particular SAF blend.
For customers, the practical issues are which charges apply, what a carrier’s emissions or SAF product actually covers, how reductions are calculated and allocated, and what documentation supports the claim. Distinguish a contractual emissions attribute from the physical fuel on a particular flight. Avoid assuming a “green lane” automatically provides regulatory clearance, lower cost, or guaranteed capacity.
Start with one lane, one bottleneck, and one accountable decision
In the next week: select the lanes with the greatest delivery consequence or margin exposure. Establish actual performance and cost baselines, validate customer priorities, and name the owners of the main exceptions.
Over the following month: test an alternative with real freight where appropriate, correct a recurring data or ground-handling failure, and review the result against delivered service and contribution margin. Agree in advance when to expand, stop, or revert.
Before a longer commitment: require evidence that demand persists, that the ground operation can support it, and that the economics survive a downside case. Separate options you can activate quickly from investments that need sustained volume.
Air cargo flows become useful strategic intelligence when they change an executable decision: the capacity protected, the route qualified, the customer promise made, or the bottleneck addressed.
Where Diakon can help: Diakon Partners works with businesses and associations to assess how policy changes, lane exposure, and infrastructure constraints affect operating priorities. Contact us to discuss a focused assessment of the decisions your organization needs to make, the evidence still missing, and the practical steps available.