
How to identify the staffing constraints that actually limit service—and choose a workable response
Updated October 18, 2026
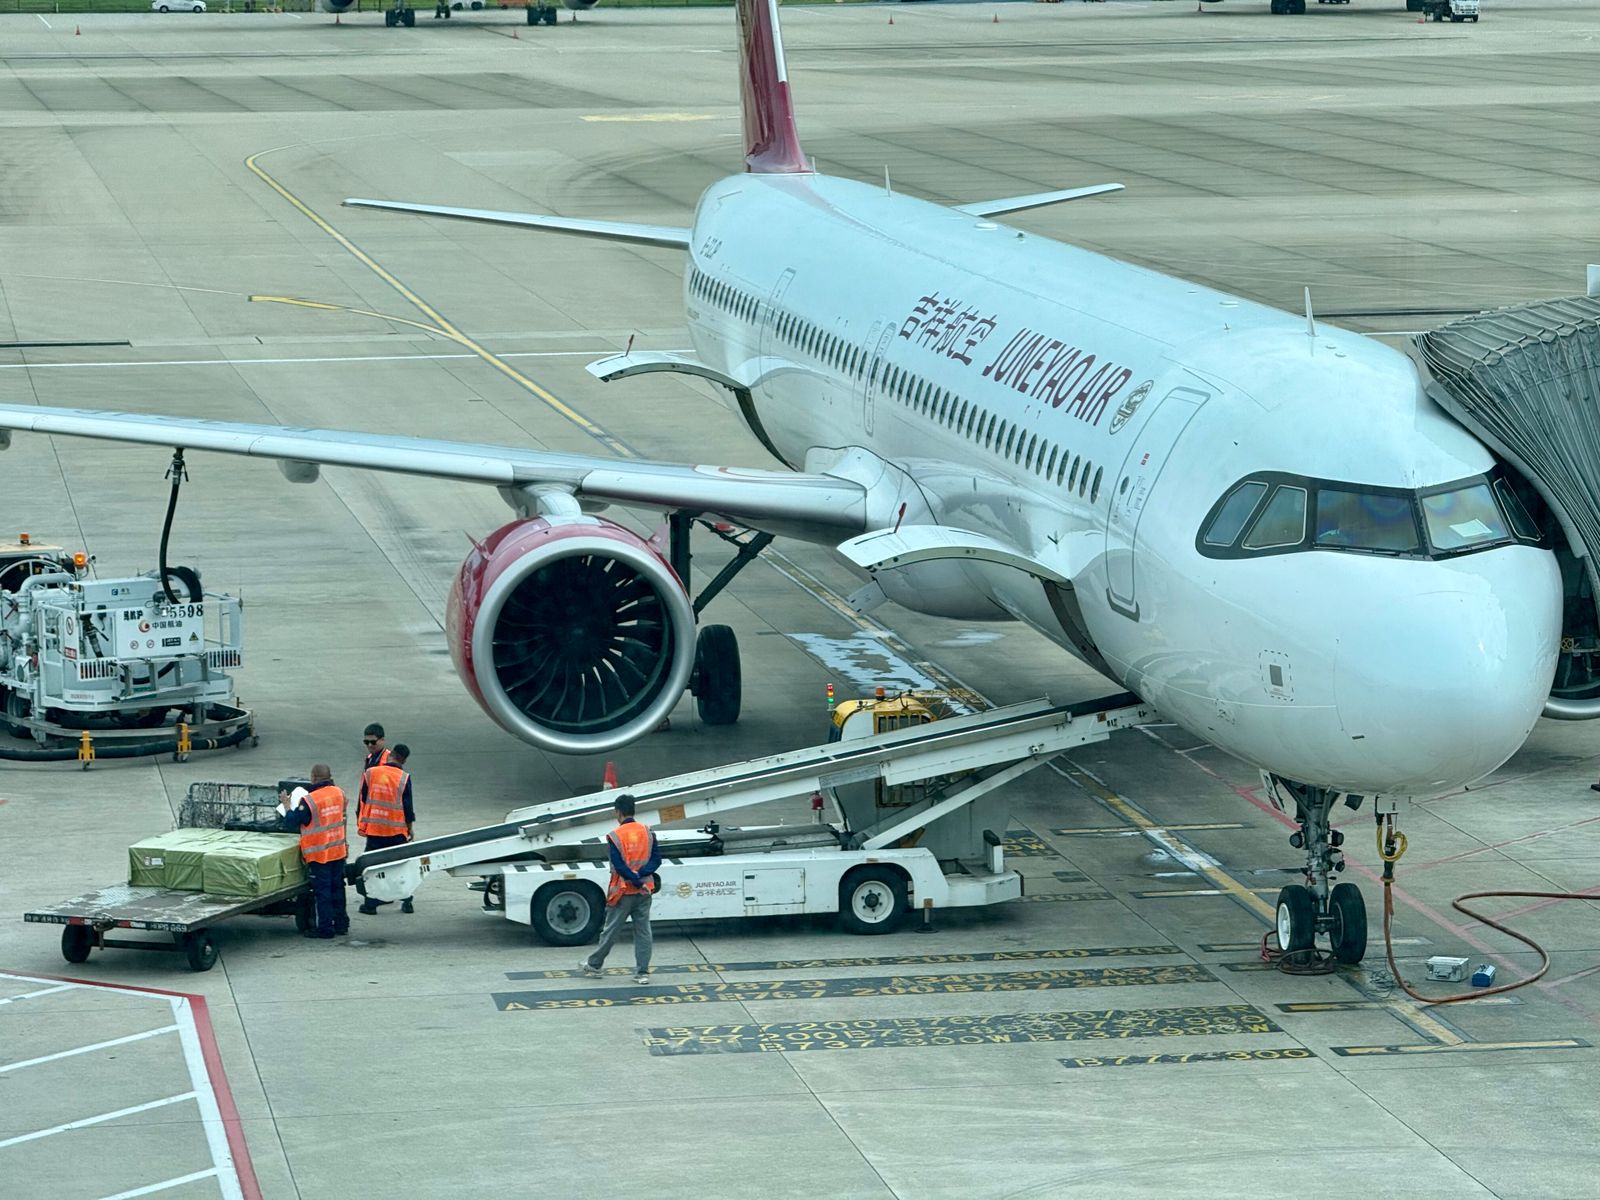
An airline can offer space that a shipment cannot reach in time. Freight arrives at the terminal, but the qualified team needed to accept, screen, build, document, or release it is unavailable during the critical window. The resulting capacity problem sits between the flight schedule and the customer’s delivery commitment.
For forwarders, carriers, handlers, airports, and shippers, workforce planning should start with those operating windows. The question is how much freight the whole chain can move reliably, with the people, skills, equipment, and approvals actually available. More headcount helps when it addresses the constraint. Hiring into the wrong shift or automating the wrong task can leave the missed connection unchanged.
What is changing in the workforce
Restructuring can mean four different problems: difficulty recruiting, departure of experienced workers, changing task requirements, or a mismatch between staffing and the flight schedule. They require different responses. A station with enough employees overall may lack a qualified document reviewer during the evening bank. Another may hire steadily but lose new staff before they become independently productive.
Assess the change against the operation’s own history. Compare qualified coverage, shipment mix, training needs, and service failures by role and shift. Separate a short-lived demand surge from a recurring gap before committing to permanent labor or equipment.
Read the market evidence at the right level
IATA reported that global air cargo demand grew 4.4% year over year in August 2026, while available cargo capacity fell 0.1%. For North American airlines, demand rose 6.6% and capacity fell 2.5%. These cargo tonne-kilometer measures describe airline traffic and available flying capacity; local handling coverage still needs separate assessment. [1]
BLS projects approximately 13,100 annual openings, on average, for aircraft and avionics equipment mechanics and technicians over 2025–2035, with combined employment growing 6%. Many openings replace departing workers. This national occupational projection covers employers beyond air cargo and measures openings rather than a technician shortfall. [2]
Use the market signals to identify exposed flights and customers, then diagnose the local constraint. Require a clear occupation, geography, period, and definition before using any shortage or turnover statistic in a staffing decision.
Measure usable capacity by role and operating window
Map a shipment from truck arrival through acceptance, screening where applicable, build-up, aircraft handoff, destination breakdown, and collection. At each step, identify the required competence, available qualified coverage, equipment, expected workload, and deadline. Use the actual process for the operation; not every shipment follows the same sequence.
Headcount is an incomplete measure. An employee awaiting required clearance or training may not yet be available for a particular task. A trained worker assigned elsewhere may not be available during the flight bank. Overtime may cover an occasional absence but can become an expensive and fragile substitute for a sustainable roster.
Look separately at maintenance coverage, ramp and warehouse work, shipment documentation, and supervision. They interact, but they are not interchangeable. A document error can hold cargo despite adequate handling staff. A failed piece of ground equipment can constrain a fully staffed shift. Adding labor should follow a diagnosis of the delay, rather than become the default response.
A realistic staffing example
Consider a hypothetical shipment-document review team facing 120 standard document checks during a three-hour evening window. Suppose a timed sample shows six staff-minutes per document check, including ordinary corrections. That is 720 staff-minutes, or 12 hours of direct work. If four qualified reviewers can each devote 2.5 hours to those checks after other assigned duties and breaks, the team has ten hours available: a two-hour gap.
The example covers a defined desk review of standard shipment records before tender. It excludes physical unloading, security screening, dangerous-goods acceptance, and aircraft loading. Those activities require separate workload and qualification assessments. All figures are illustrative assumptions to replace with a timed local sample.
That arithmetic identifies a planning problem, not a staffing standard. Document-review requirements depend on shipment mix, arrival bunching, required checks, supervision, and the available equipment. Complex or exceptional shipments should be modeled separately. Every reviewer also needs the applicable permissions and training. Average workload can fit the window while a late surge still misses cutoff.
Compare practical responses: move some customer tenders earlier; arrange two additional hours of qualified coverage; remove a duplicate data-entry step; or narrow the promised acceptance window. Confirm whether an earlier shift or another team has genuinely spare qualified capacity before moving work there. Hiring a new employee will not resolve tonight’s gap if onboarding and task qualification remain incomplete.
If a tested workflow change cuts net document-review time from six to five minutes per check, demand falls to ten staff-hours for this example. That exactly matches average available time, leaving no buffer for variability. It is not enough evidence to promise reliable service. Test the arrival pattern and difficult cases, then establish a buffer and fallback appropriate to the customer consequence. No reduction in required checks is assumed.
The evening document-review window
| Current work required | 120 checks × 6 minutes = 12 staff-hours |
| Qualified time available | 4 reviewers × 2.5 hours = 10 staff-hours |
| Gap before any buffer | 2 staff-hours |
| Tested five-minute process | 120 checks × 5 minutes = 10 staff-hours |
| Decision | Average balance is not a reliability buffer. |
Match the symptom to the decision
| Symptom and evidence | Response and tradeoff | Accountable lead |
| Early exits: cohort retention and exit reasons | Test onboarding, shift stability, or job design; allow trainer time. | HR + station manager |
| Peak backlog: arrivals and qualified coverage by interval | Test earlier tender or shift overlap; check upstream costs. | Station operations + customer lead |
| Skill gap: task approvals and backup coverage | Cross-train with assessed competence; protect production coverage. | Training + operations |
| Rework: error types and correction minutes | Repair data or test automation; include review and downtime. | Process owner + IT |
| Equipment holds: downtime and delay logs | Compare maintenance or equipment changes; avoid hiring against an equipment fault. | Maintenance + operations |
Choose the response that matches the cause
When applicants are scarce, examine the job offer and access to the workplace. Compare relevant local pay and total compensation, shift predictability, commute options, parking, and the clarity of the work. A signing bonus can improve recruitment while leaving the reasons employees depart untouched.
When early departures dominate, review the first 30, 60, and 90 days by hiring cohort. Ask whether recruits understood the shift, physical demands, pay, transport requirements, and progression. Measure time to independent competence as well as time to hire. Give trainers scheduled time; a mentor who must maintain a full production load may struggle to provide consistent support.
When a specific skill is missing, build a task-level qualification and backup matrix. Cross-training can improve resilience, but it takes instructor time and requires demonstrated competence. Preserve enough experienced coverage while people learn. Do not treat familiarity with software as authority to perform a regulated or safety-sensitive task.
When the workload arrives in peaks, examine appointment patterns, customer tender behavior, handoffs, and shift overlap before adding permanent positions. Earlier tender can help only if upstream production, trucking, and receiving schedules support it. Account for costs shifted to customers and partners.
Watch for patterns before the service failure becomes routine
Rising overtime with flat or falling correctly completed output warrants investigation. Check shipment complexity, absence, rework, and equipment availability before attributing the pattern to employee productivity. Compare similar shifts and workload, rather than raw totals.
Repeated cutoff misses on the same shift suggest a recurring operating-window problem. Review arrival bunching, qualified coverage, late documents, and handoff delays together. If new hires repeatedly leave before task qualification, examine the job offer, supervision, training access, and time spent waiting to become productive. These are diagnostic signals, not proof of a single cause.
Compare the economics before choosing a response
Keep three categories separate: new spending to add coverage, existing work moved to a different time, and capacity released by a process change. Compare each option against the same workload, service window, and reliability requirement. Earlier tender is not free: record any added customer coordination, transport, storage, earlier-shift labor, or partner cost. Do not count both avoided overtime and the same released staff-hours as separate benefits.
For the illustrative two-hour gap, assume an incremental cost of $45 per qualified staff-hour for added coverage. Two hours cost $90 per operating day, or $1,800 over 20 days. That rate is a planning assumption, not a wage benchmark; replace it with the actual incremental cost, including applicable overtime, agency charges, or minimum call-out payments. Two hours close the arithmetic gap but provide no additional buffer.
Alternatively, completing 20 of the six-minute checks before the peak moves two staff-hours out of that window. The work and its cost remain; the benefit depends on earlier documents, genuinely spare qualified capacity, and no harmful upstream delay. Include any customer or partner cost of changing the tender schedule.
For a workflow tool, assume $1,000 in monthly recurring costs and $6,000 in setup and training. If a local trial validates the one-minute net saving across all 120 daily checks, it releases two staff-hours per day. Only if it avoids the full $1,800 in incremental coverage does the simplified monthly cash benefit reach $800, with setup payback of 7.5 months after steady-state benefits begin. Without avoidable spending, the result is capacity value rather than that cash return. These are hypothetical prices and outcomes, excluding financing, taxes, ramp-up, and unbudgeted integration or exit costs.
Training and retention measures may produce a more durable improvement, but require paid learning time, trainer coverage, and time to competence. Compare options using service reliability, total incremental cost, implementation time, worker impact, and reversibility. A cheaper average process is insufficient if it misses the customer’s critical cutoff.
Use automation to remove friction without moving the bottleneck
Start with a defined burden: repeated entry of shipment data, retrieval of supporting documents, or preparation of a status message from verified milestones. Test against the present process, including review, correction, exception handling, training, and system downtime. Faster preparation creates little benefit if it feeds an already overloaded acceptance desk.
Keep the distinction between assistance and authority explicit. A tool may assemble documents for review; it should not silently expand who may approve release or bypass a required check. Retain a usable manual process and a named escalation owner. For physical automation, evaluate equipment availability, maintenance support, safe interaction with workers, and recovery when the system stops.
Protect the learning pathway. If routine work is reduced, define how newer employees will learn to recognize bad data, unusual shipments, and exceptions. Pair supervised practice with experienced review, then verify competence on representative cases. Technology should have a measurable service or cost benefit and a workable training model before wider deployment.
Connect workforce choices to the customer commitment
Forwarders should validate tender cutoffs, handling coverage, exception contacts, and recovery options with the station that will perform the work. Compare alternate gateways on total elapsed time and execution risk, including trucking, transfer, clearance where applicable, and destination collection. A cheaper flight may be more expensive after an avoidable hold or recovery movement.
Carriers and handlers should align sales commitments with the capacity available during the actual flight bank. Track which stage causes missed uplift or late availability, and agree how partners will receive an accurate revised status. A staffing gap at breakdown requires a different response from a documentation backlog before departure.
Airports can convene employers, educators, workforce boards, and transport providers around common barriers such as training access and overnight commuting. Manufacturers, technology companies, retailers, and other shippers should identify the consequence of a delay—production interruption, installation rescheduling, spoilage, or lost sales—and set recovery choices accordingly. Use the customer’s actual exposure rather than assume every shipment warrants premium capacity.
Build the pipeline while protecting worker mobility
FAA announced $26 million in aviation workforce development funding opportunities in May 2026, covering pilot and maintenance pathways. That supports the case for structured education and employer partnerships, but it is not a general subsidy for every cargo warehouse or ramp position. A funding announcement is not evidence that an employer has secured an award. [3]
Before relying on public support, verify the current notice, eligible applicant, covered occupation, allowable costs, application deadline, and any award conditions. Schools and employers should define who recruits, who teaches, who provides paid practical experience, and what completion makes the participant qualified to do. Measure placement, retention, and progression; enrollment alone does not create operational coverage.
Airport-wide cooperation should widen access to skills and work. Keep hiring and compensation decisions independent. Do not organize a shared training effort around agreements to avoid recruiting one another’s workers or coordinate pay. Federal antitrust guidance identifies wage-fixing and no-poach agreements as potential criminal risks. Obtain appropriate review before sharing competitively sensitive employment information. [4]
Define the measures before the trial
Qualified coverage: divide qualified staff-hours available for the defined task in the critical window by the staff-hours that workload requires. Deduct breaks and other assigned duties once. Report the underlying hours and arrival pattern alongside the ratio; 100% coverage leaves no capacity buffer in the illustrative model.
Early retention: for a hiring cohort whose full 90-day period has elapsed, divide employees still employed at day 90 by the number who started. Separate voluntary exits, dismissals, and transfers. Compare equivalent roles and shifts; a small cohort can produce a volatile percentage.
Time to competence: count calendar days from the start date to documented approval for independent performance of the defined task. Report the median and a slower-case measure such as the 90th percentile, plus the number still awaiting approval. Do not hide unfinished training by reporting only successful completions.
Labor-related missed cutoffs: record shipments missing the agreed cutoff where an incident review identifies insufficient qualified coverage as a primary or contributing cause. Divide by shipments subject to that cutoff, and separate mixed-cause cases. Use a consistent review method before comparing periods.
Cost per correct document check: divide the defined process’s labor, allocated recurring tool and support costs, and correction costs by checks completed accurately within the required window. Show setup costs separately and include them in the overall business case. Count correction labor once, and monitor the total error and backlog counts alongside this unit cost.
A practical review for the next 30 to 90 days
In the first 30 days, select the two most consequential service failures and trace them to the role, shift, task, and handoff involved. Establish a baseline from ordinary and difficult operating days. Separate staffing, qualification, equipment, and information problems. Assign an operations owner and a finance partner.
Over the following month, test a limited response: revised shift overlap, a retention change, a supervised training cohort, a tender adjustment with one customer, or a narrow automation trial. Record implementation and review costs. Agree in advance what would justify expansion or require a pause, including a failure of a required safety or security control.
By the next review, compare cost per correctly completed shipment, missed cutoffs attributable to the targeted process, overtime, early retention, and time to competence. Check whether the gain survived busy days and whether work or cost simply moved to another team. These are management planning intervals, not promises that a hiring or certification pipeline can be completed within 90 days.
At the next management meeting, identify the two recurring failures with the highest documented recovery cost or customer consequence. Assign an accountable owner to each, specify the evidence to collect, and set a review date. At that review, decide whether to expand the response, change it, or stop it. Track recovery spending and service exposure separately so an unpriced customer risk is not mistaken for a measured loss.
Diakon Partners helps businesses and associations connect workforce realities with transportation policy, technology choices, infrastructure planning, and stakeholder engagement. The useful starting point is a specific service constraint, a clear account of its customer impact, and evidence strong enough to support the next operating or policy decision.
Sources and scope
Sources checked October 18, 2026. Operating recommendations are Diakon analysis. The staffing calculation is hypothetical, not a measured client result. National projections and airline traffic measures do not establish a local labor shortage.